OSPF Watcher
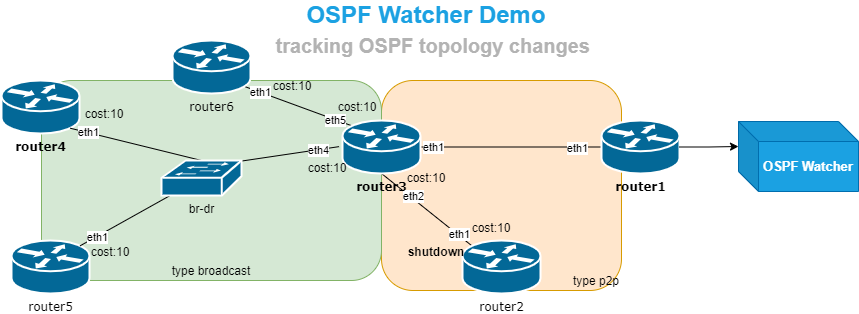
OSPF Watcher is a monitoring tool for OSPF topology changes. It passively listens to the OSPF control plane — over a GRE adjacency or BGP-LS — and logs every change and/or exports it (via Logstash or Fluent Bit) to ELK, Zabbix, WebHooks, and the Topolograph monitoring dashboard. Everything ships as containers, so it starts fast.
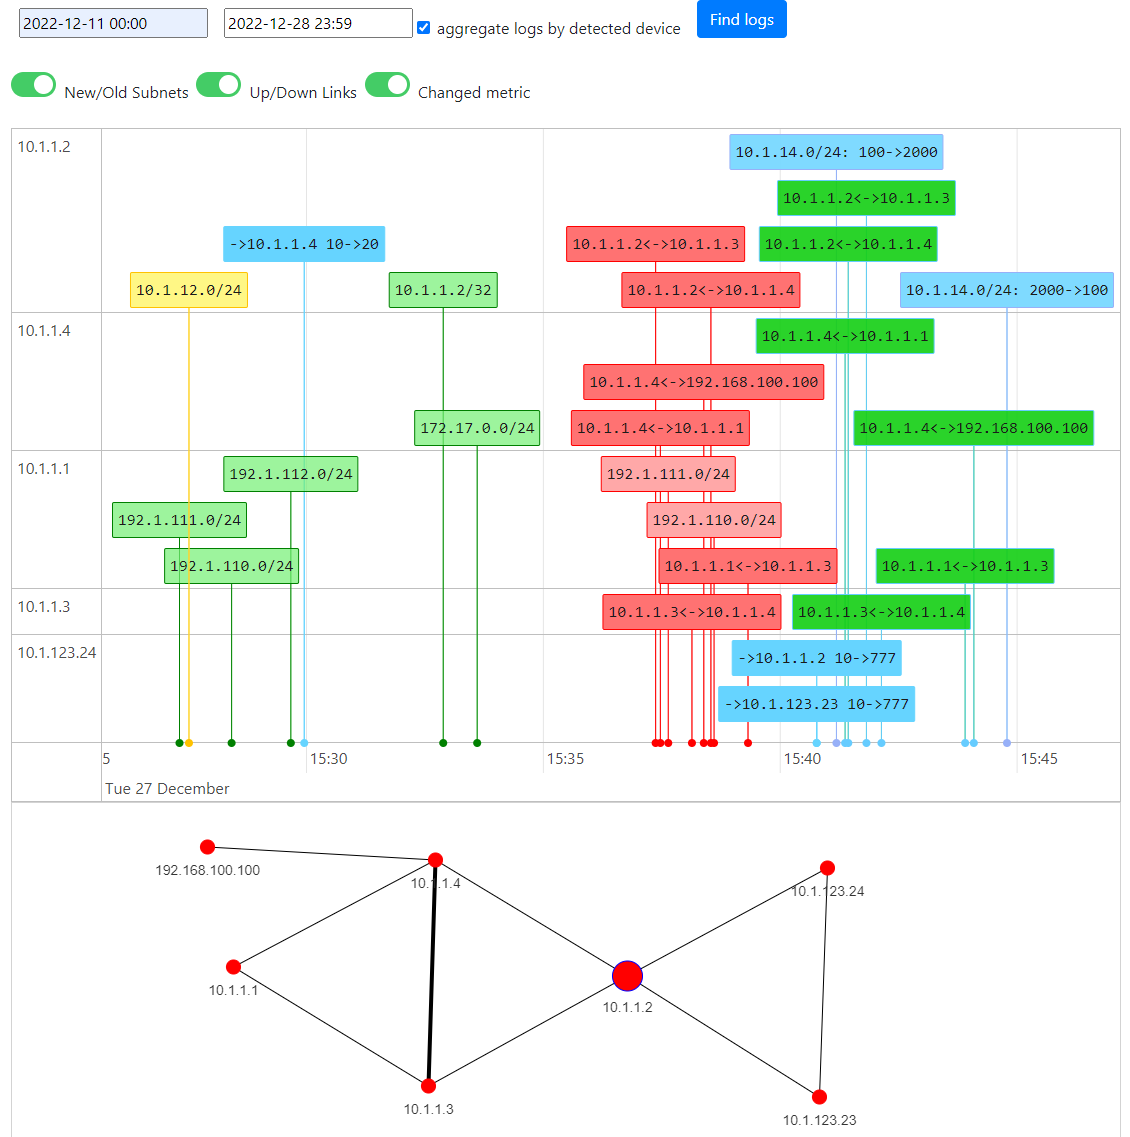
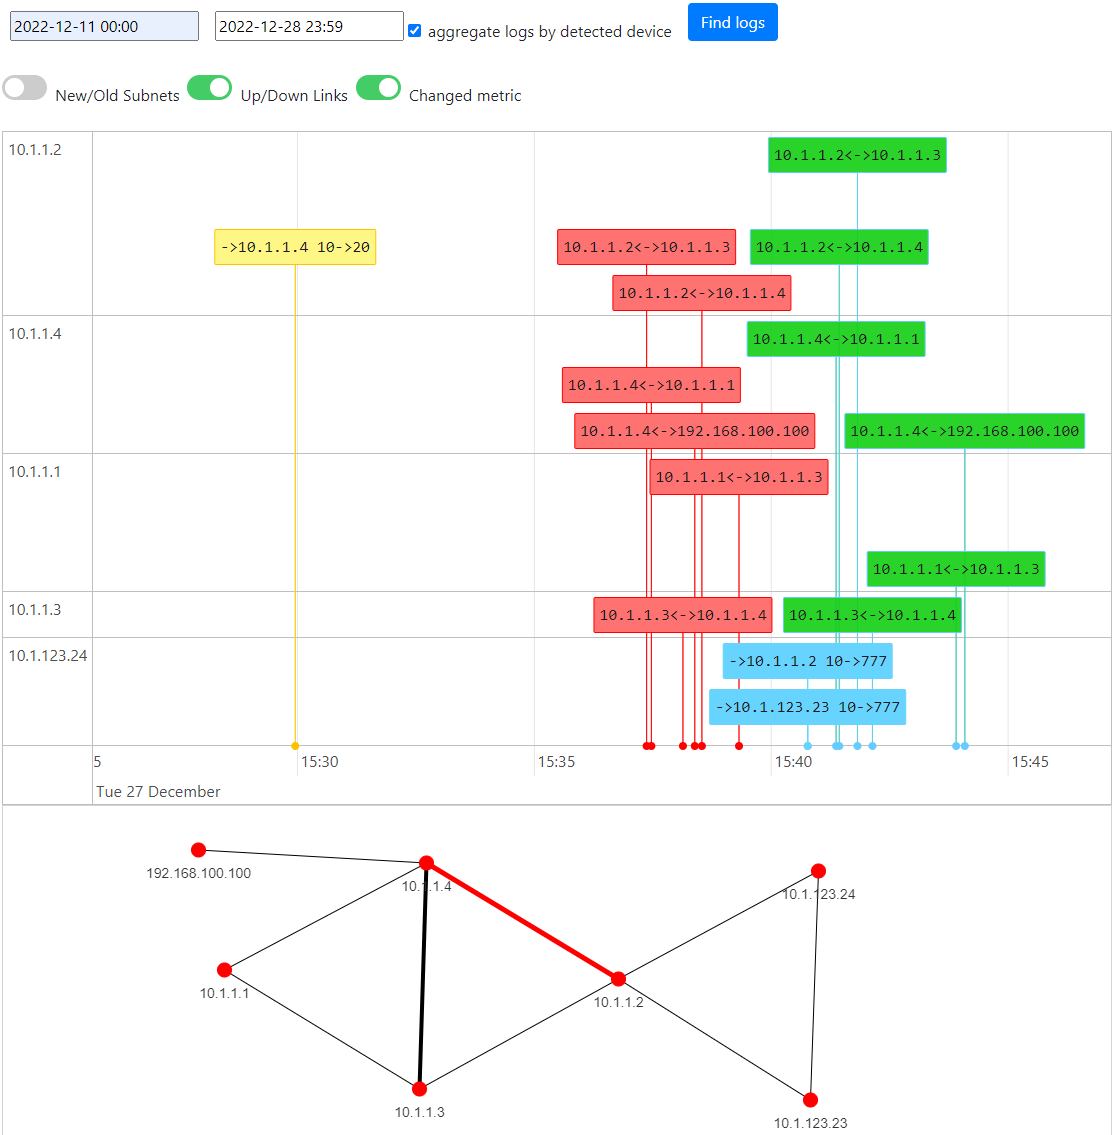
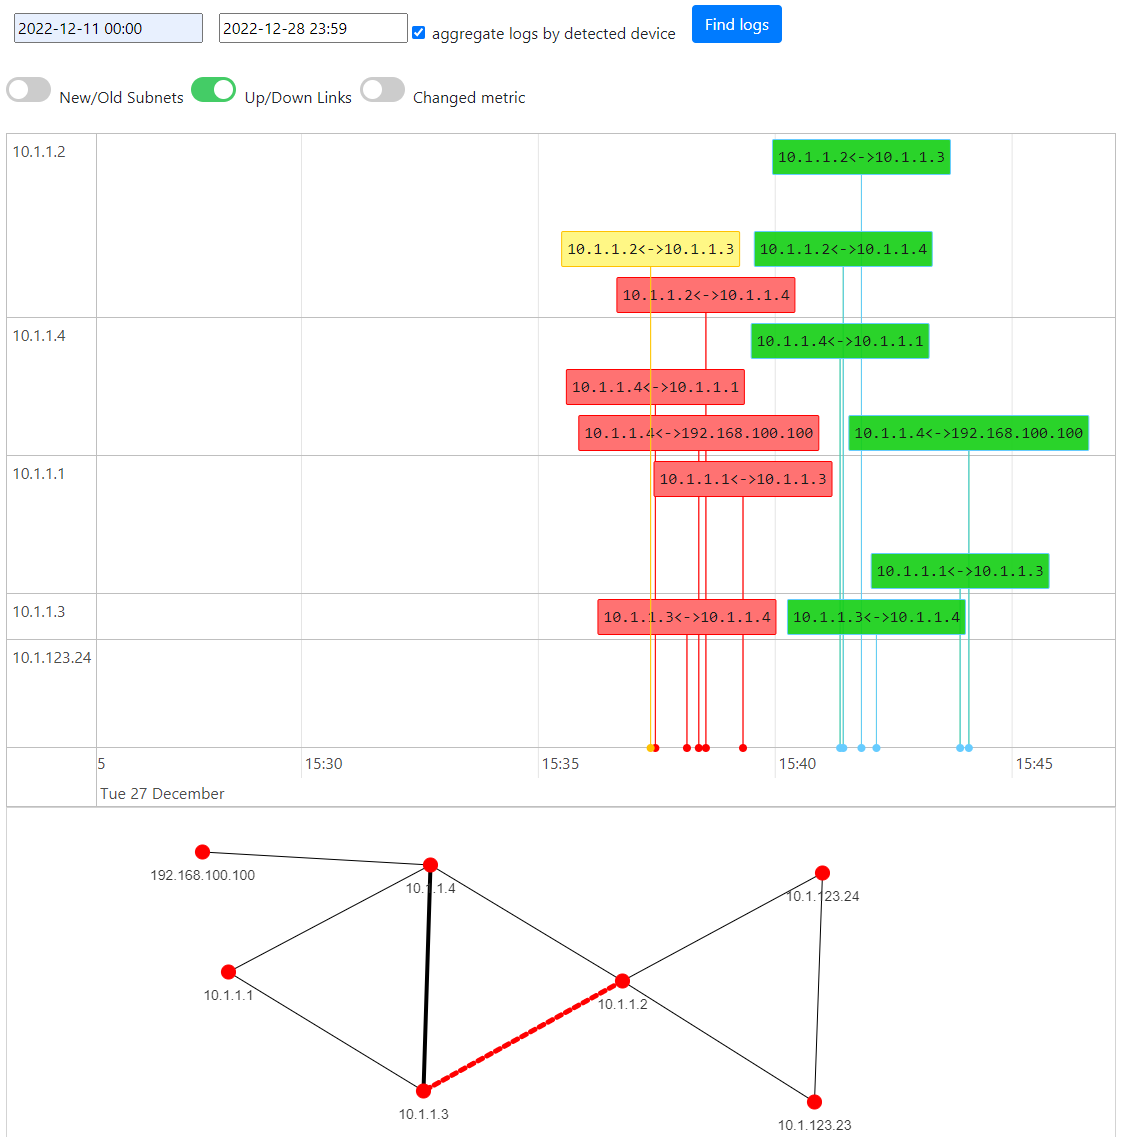
Detected events
- OSPF neighbor adjacency Up/Down
- OSPF link cost changes
- OSPF networks appearing/disappearing
- OSPF TE attributes (via opaque LSA or BGP-LS): administrative group, maximum link bandwidth, maximum reservable bandwidth, unreserved bandwidth, TE default metric, and shared risk link group (SRLG)
- OSPF node role changes: a router becoming (or ceasing to be) an ABR (Area Border Router), ASBR (AS Boundary Router), or entering/leaving max-metric (RFC 3137 stub router — all transit links advertised at the maximum metric to steer transit traffic away; the OSPF analog of the IS-IS overload bit)
Connecting it
The connection itself is set up under Getting Topology In:
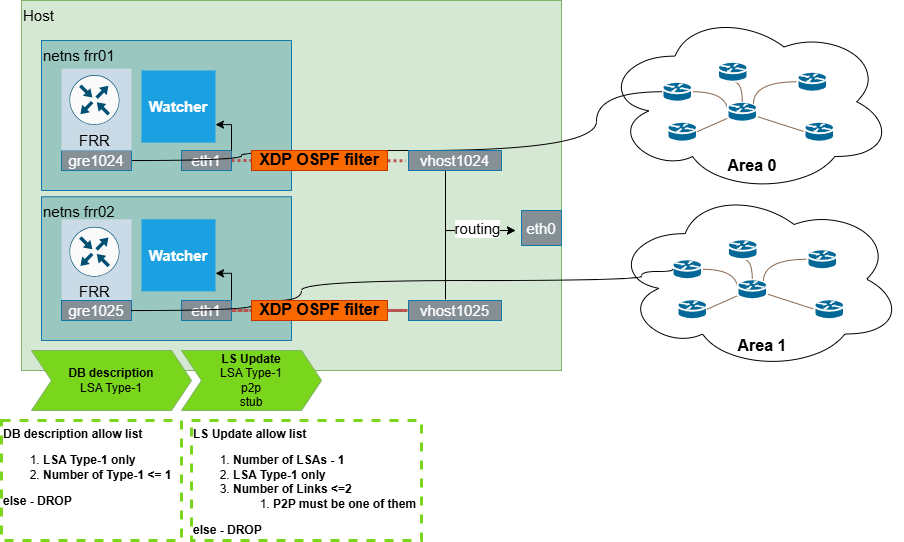
- GRE mode — FRR forms an OSPF adjacency over a GRE tunnel. An XDP OSPF filter guarantees the Watcher stays listen-only.
- BGP-LS mode — the router exports OSPF topology over
BGP-LS; GoBGP + the forwarder feed the Watcher. Requires image
vadims06/ospf-watcher:v3.1.0or newer.
Compatibility
OSPF network changes appear on the Topolograph graph with topolograph v2.27 or later.
Quick lab (containerlab)
A ready-made lab under containerlab/frr01 lets you watch OSPF changes with no
real hardware:
In this minimal setup the Watcher prints topology changes to a text file. Add Topolograph and/or ELK to visualize and search them — see the deployment sizes table.
No device? Test mode
Set TEST_MODE=True to replay a demo LSDB and sample events (adjacency loss,
metric change) end-to-end through the pipeline.
Event log format
Watcher events are simple comma-separated lines. A host (adjacency) event:
2023-01-01T00:00:00Z,demo-watcher,host,10.10.10.4,down,10.10.10.5,01Jan2023_00h00m00s_7_hosts,0,1234,192.168.145.5
10.10.10.5detected that host10.10.10.4, on the interface with192.168.145.5, in area0/ AS1234, went down at the timestamp.
A metric-change event:
2023-01-01T00:00:00Z,demo-watcher,network,192.168.13.0/24,changed,old_cost:10,new_cost:12,10.10.10.1,01Jan2023_00h00m00s_7_hosts,0.0.0.0,1234,internal,0
10.10.10.1detected that the metric of internal stub network192.168.13.0/24changed from10to12.
A node-flag change event:
2023-01-01T00:00:00Z,demo-watcher,node,10.1.1.3,changed,attr:abr,old:0,new:1,10.1.1.3,01Jan2023_00h00m00s_7_hosts,0,1234
10.1.1.3advertised itself as an ABR (abr0→1). One event is emitted per changed flag (abr,asbr,maxmetricfor OSPF;overload,attachedfor IS-IS). Entering max-metric also emits ametricevent per link, since every transit link cost jumps to its maximum.
These records are what Logstash/Fluent Bit forward to ELK, Zabbix and Webhooks.
Listen-only mode (XDP)
In GRE mode the Watcher runs a real FRR instance — so it's critical that it can never inject prefixes into your OSPF domain. An XDP filter inspects every OSPF message FRR tries to send and drops anything that advertises more than the Watcher's own GRE tunnel network.
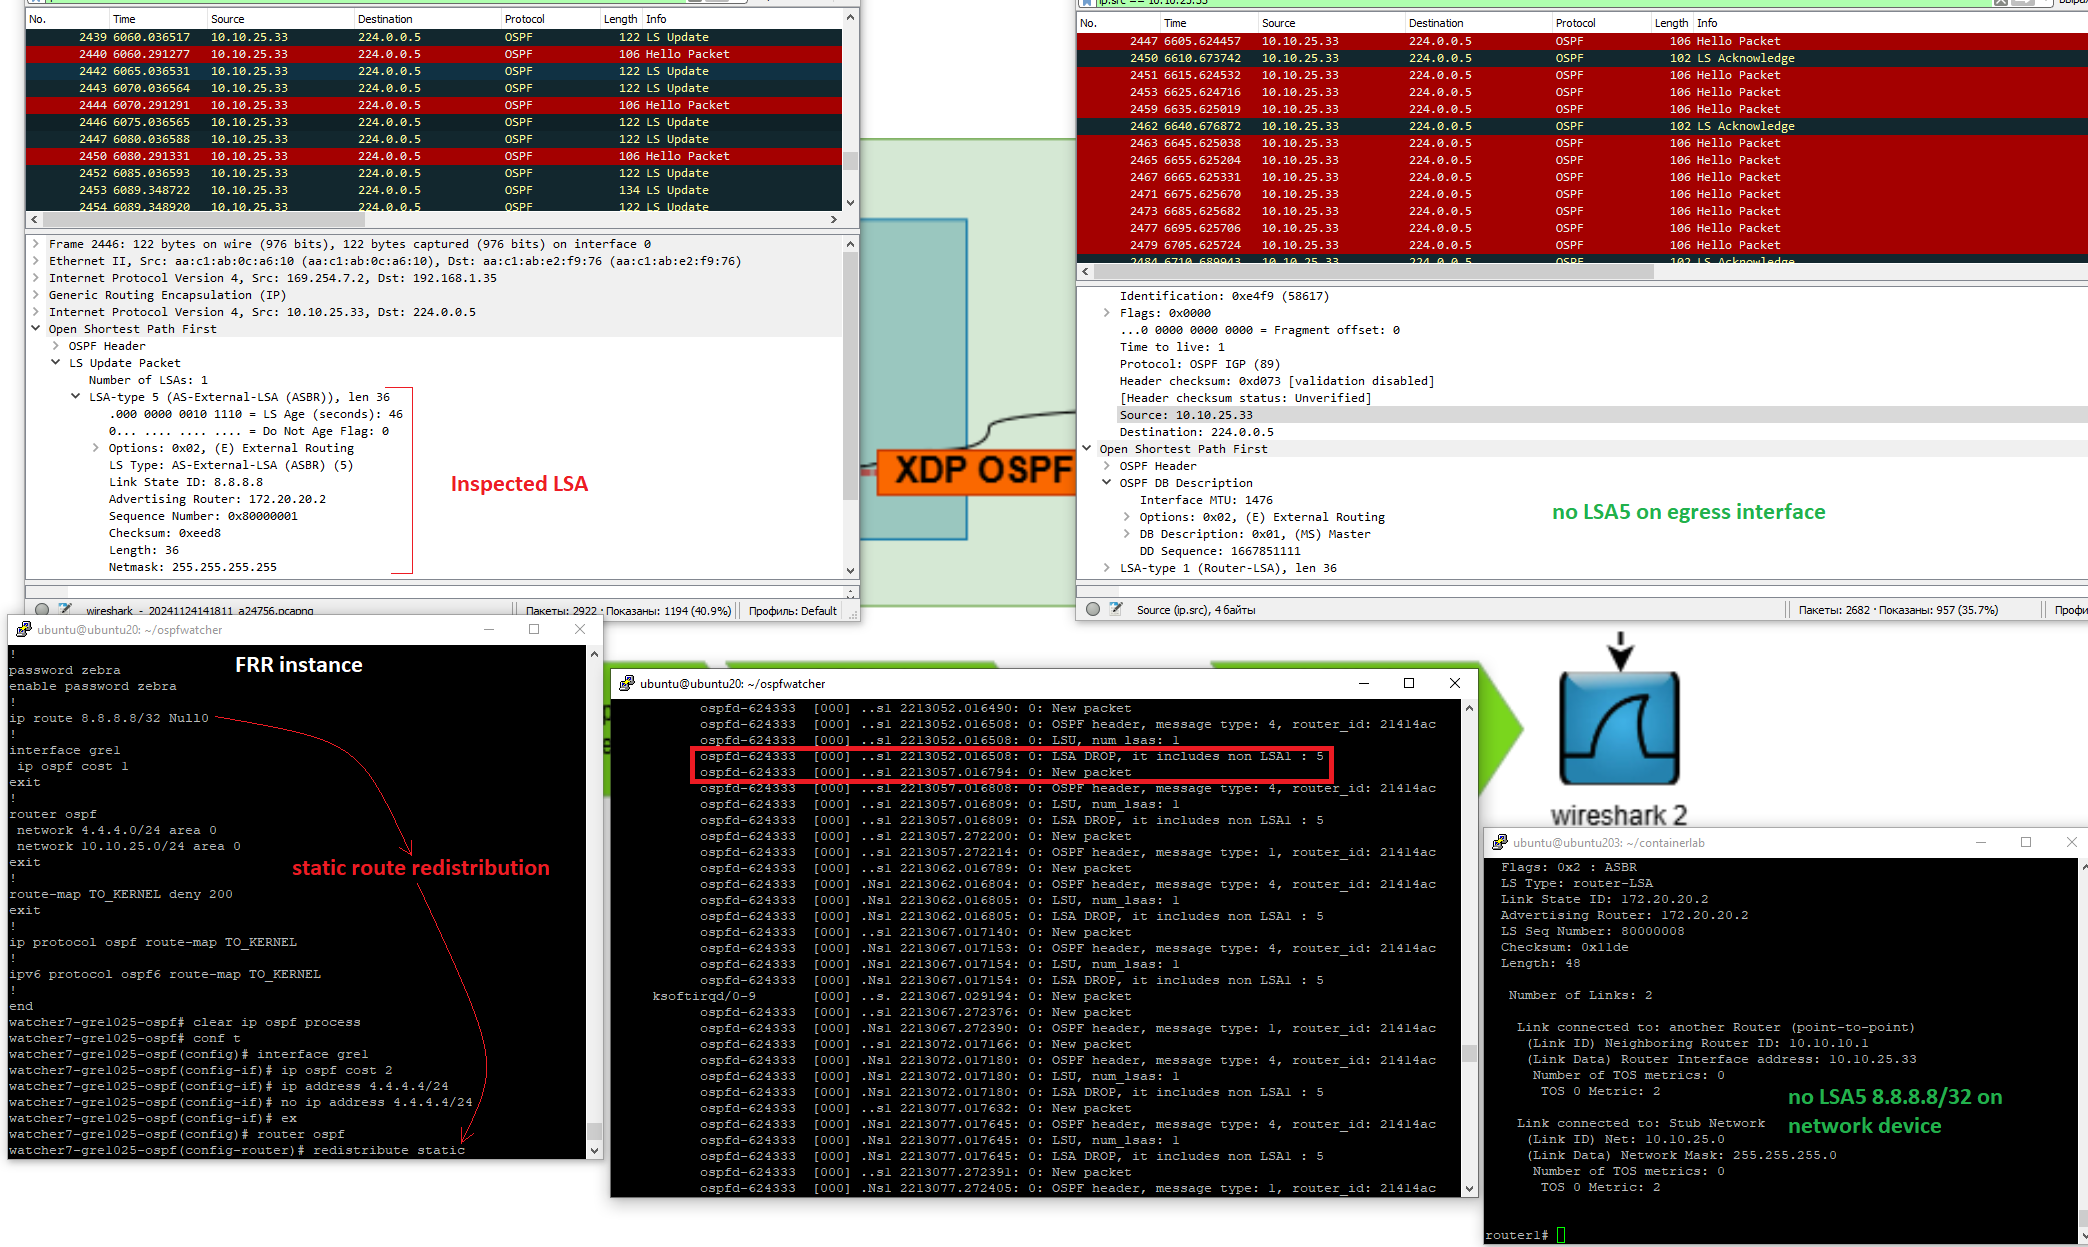
For example, if 8.8.8.8/32 were accidentally redistributed on the Watcher, the
LSA 5 is dropped by XDP and never reaches the network. The same protection
applies to Database Description messages and to extra stub networks in LSA 1.
Useful commands:
# Watch XDP drop logs
sudo cat /sys/kernel/debug/tracing/trace_pipe

# Confirm the XDP program is attached to the Watcher's interface
ip l show dev it-vhost1025      # look for "prog/xdp id ..."

# Enable / disable the filter
sudo docker run -it --rm -v ./:/home/watcher/watcher/ --cap-add=NET_ADMIN \
  -u root --network host vadims06/ospf-watcher:latest \
  python3 ./client.py --action enable_xdp --watcher_num <num>
Troubleshooting
GRE mode — confirm the adjacency:
Your device should appear as a neighbor. If not, run the Watcher's diagnostic script (see the repo's troubleshooting section).
BGP-LS mode — the Watcher posts to Topolograph only after the BGP session is up. Check it:
docker logs watcher<num>-bgpls-ospf-bgplswatcher
docker exec -it watcher<num>-bgpls-ospf-bgplswatcher gobgp neighbor
docker exec -it watcher<num>-bgpls-ospf-bgplswatcher gobgp global rib -a ls
See BGP-LS session for the full verification flow.
Related: IS-IS Watcher · ELK / Kibana · Zabbix · Webhooks