ELK / Kibana Integration
For full-text search, dashboards and long-term history of topology events, ship Watcher output into the Elastic Stack (ELK). Logstash (or Fluent Bit) forwards each event; Elasticsearch indexes it; Kibana lets you explore it.
This corresponds to deployment size #3.
Pipeline
flowchart LR
    W[OSPF / IS-IS Watcher] --> LS[Logstash / Fluent Bit]
    LS --> ES[Elasticsearch]
    ES --> K[Kibana]
Logstash vs Fluent Bit
- Logstash (default profile) starts together with an index-creator
container and enables the Zabbix path. Bring it up with
docker compose up -d. - Fluent Bit is a lighter alternative (profile
fluent-bit, HTTP/Webhook output only): The two send HTTP payloads in slightly different shapes — keep that in mind if you write custom consumers.
Connecting your ELK
If you already run ELK, set ELASTIC_IP in the Watcher's .env and uncomment
the Elastic block in logstash/pipeline/logstash.conf. You can create the index
templates with:
sudo docker run -it --rm --env-file=./.env \
  -v ./logstash/index_template/create.py:/home/watcher/watcher/create.py \
  vadims06/ospf-watcher:latest python3 ./create.py
No ELK yet? Spin one up from
docker-elk. For a demo, set the
license to basic and disable security in
docker-elk/elasticsearch/config/elasticsearch.yml:
Elastic output blocks other outputs on failure
If the Elastic output can't reach its host it blocks the other outputs and
keeps retrying regardless of EXPORT_TO_ELASTICSEARCH_BOOL. Only enable
(uncomment) the Elastic config when you actually have ELK running.
Kibana setup
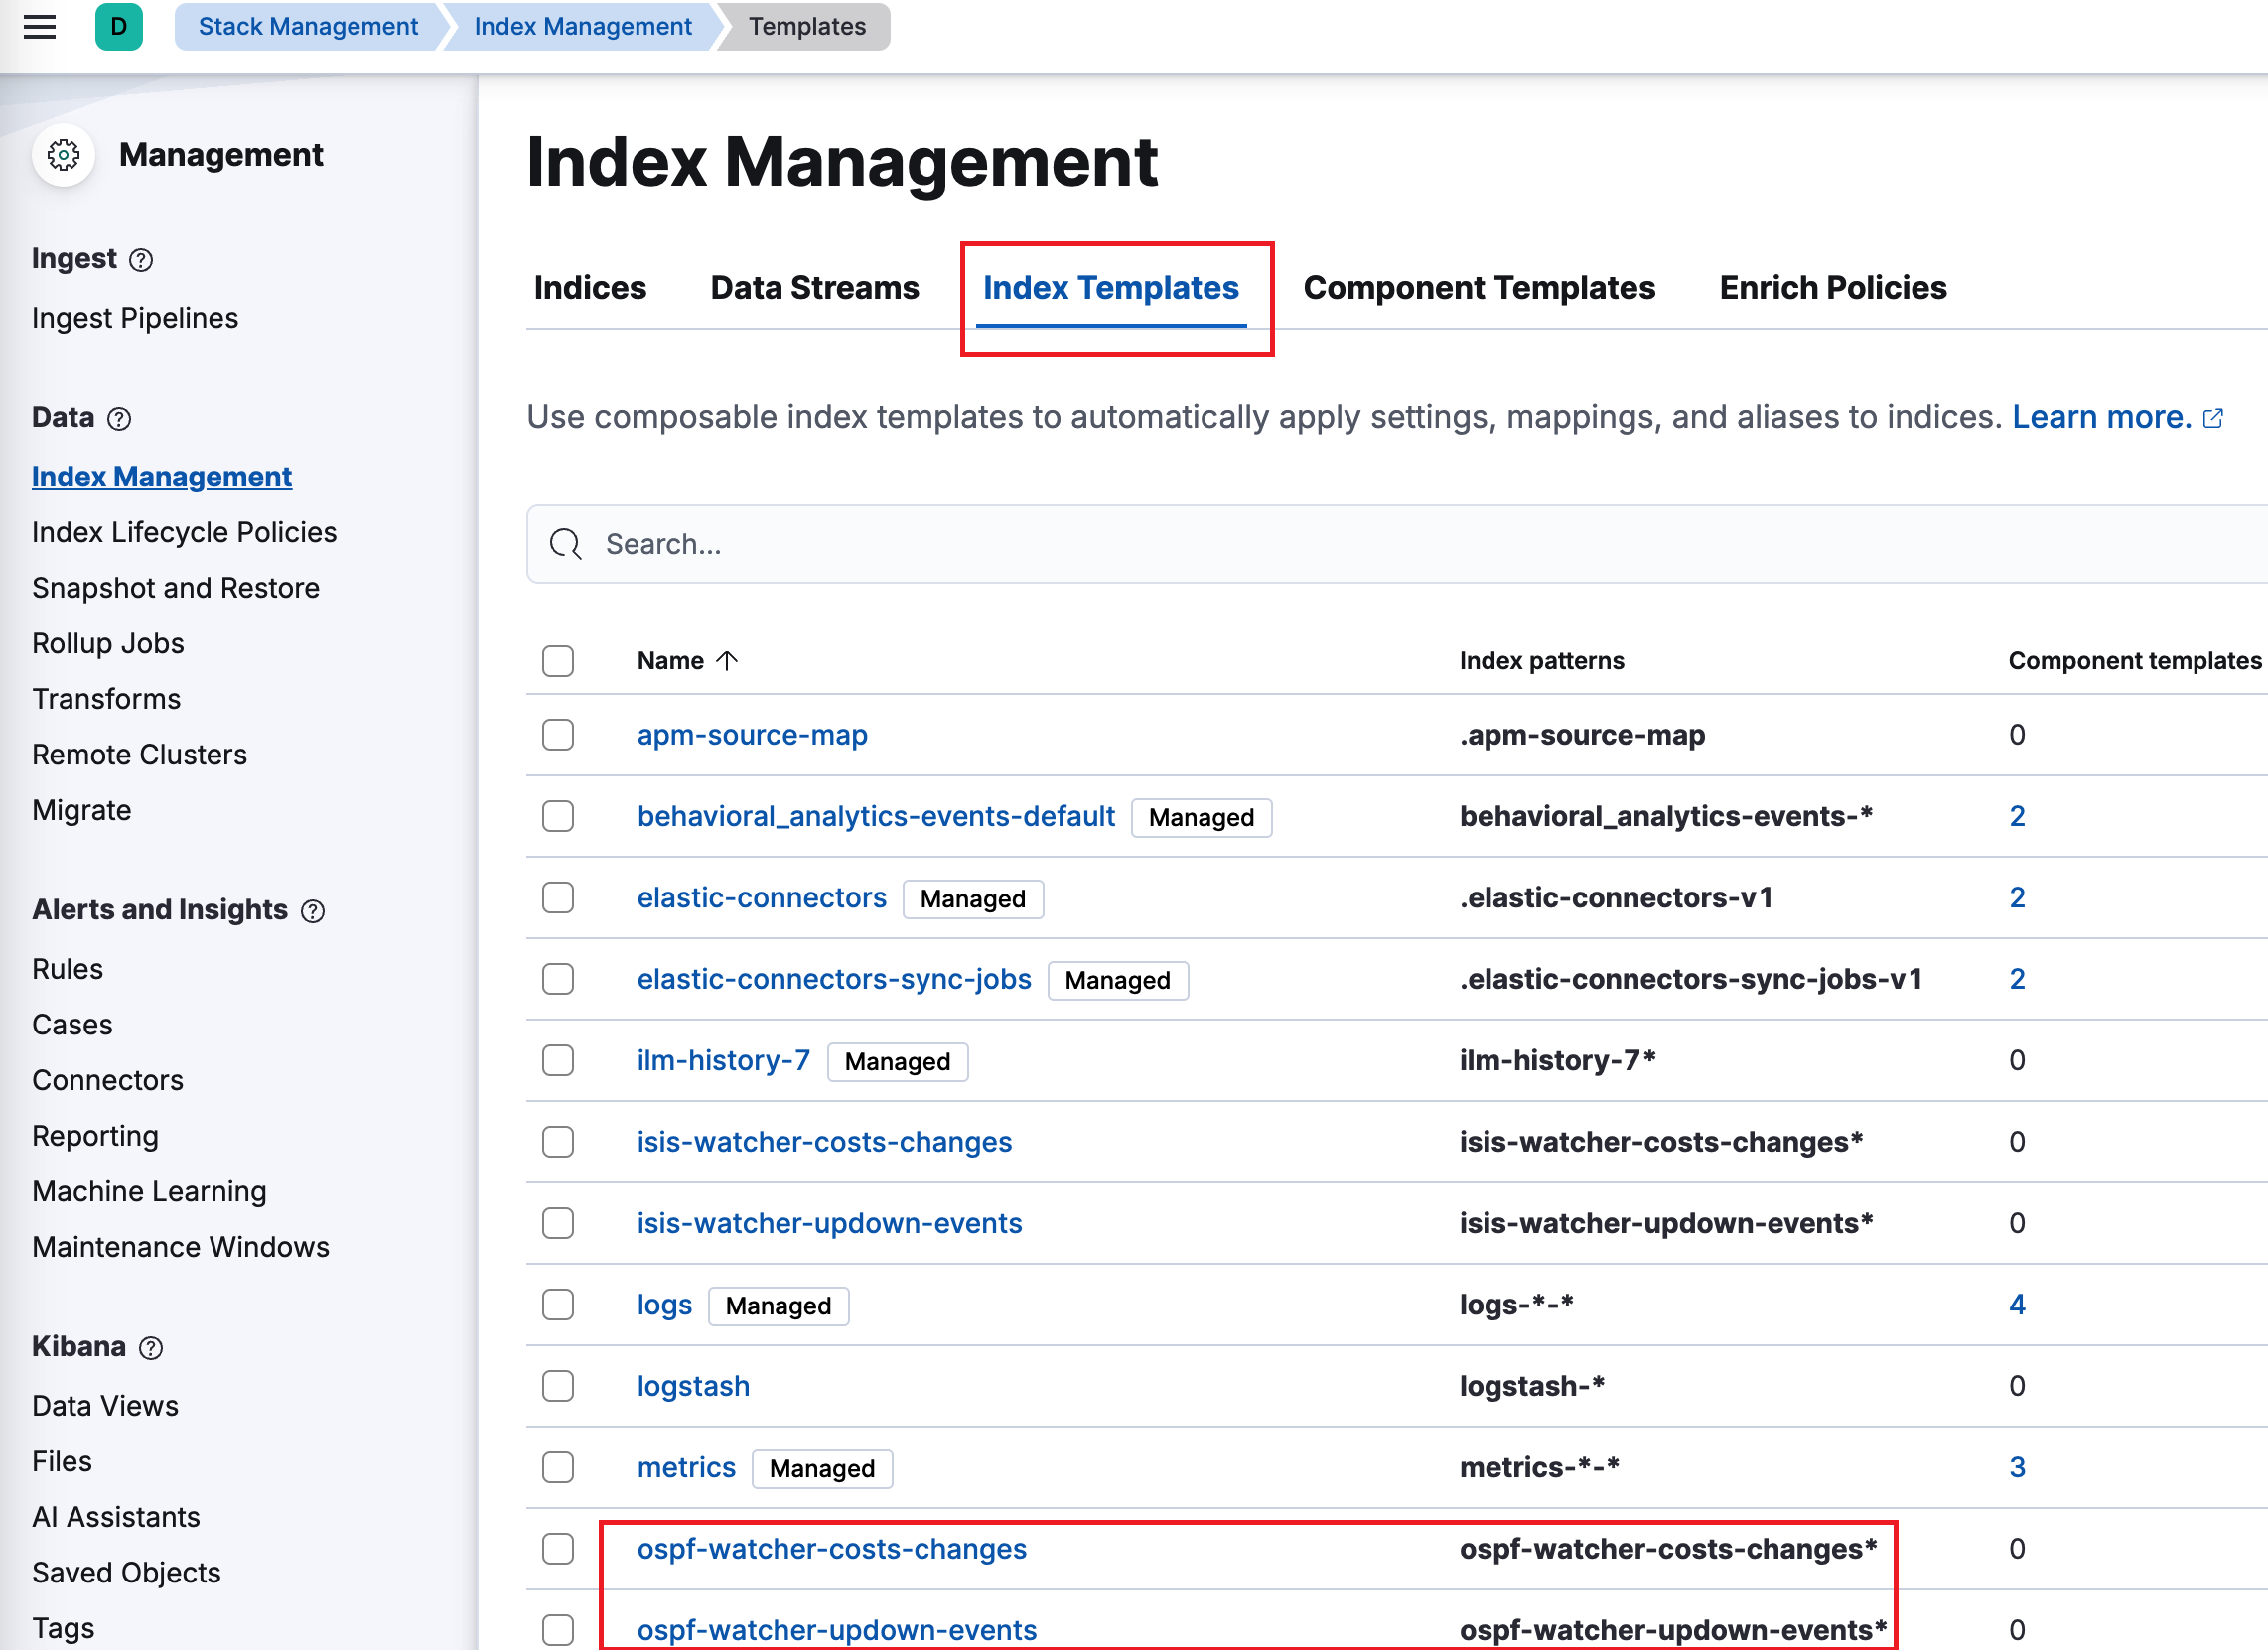
Index templates are created automatically by the index-creator container. Under Management → Stack Management → Index Management → Index Templates you should see entries such as:
ospf-watcher-costs-changesospf-watcher-updown-events
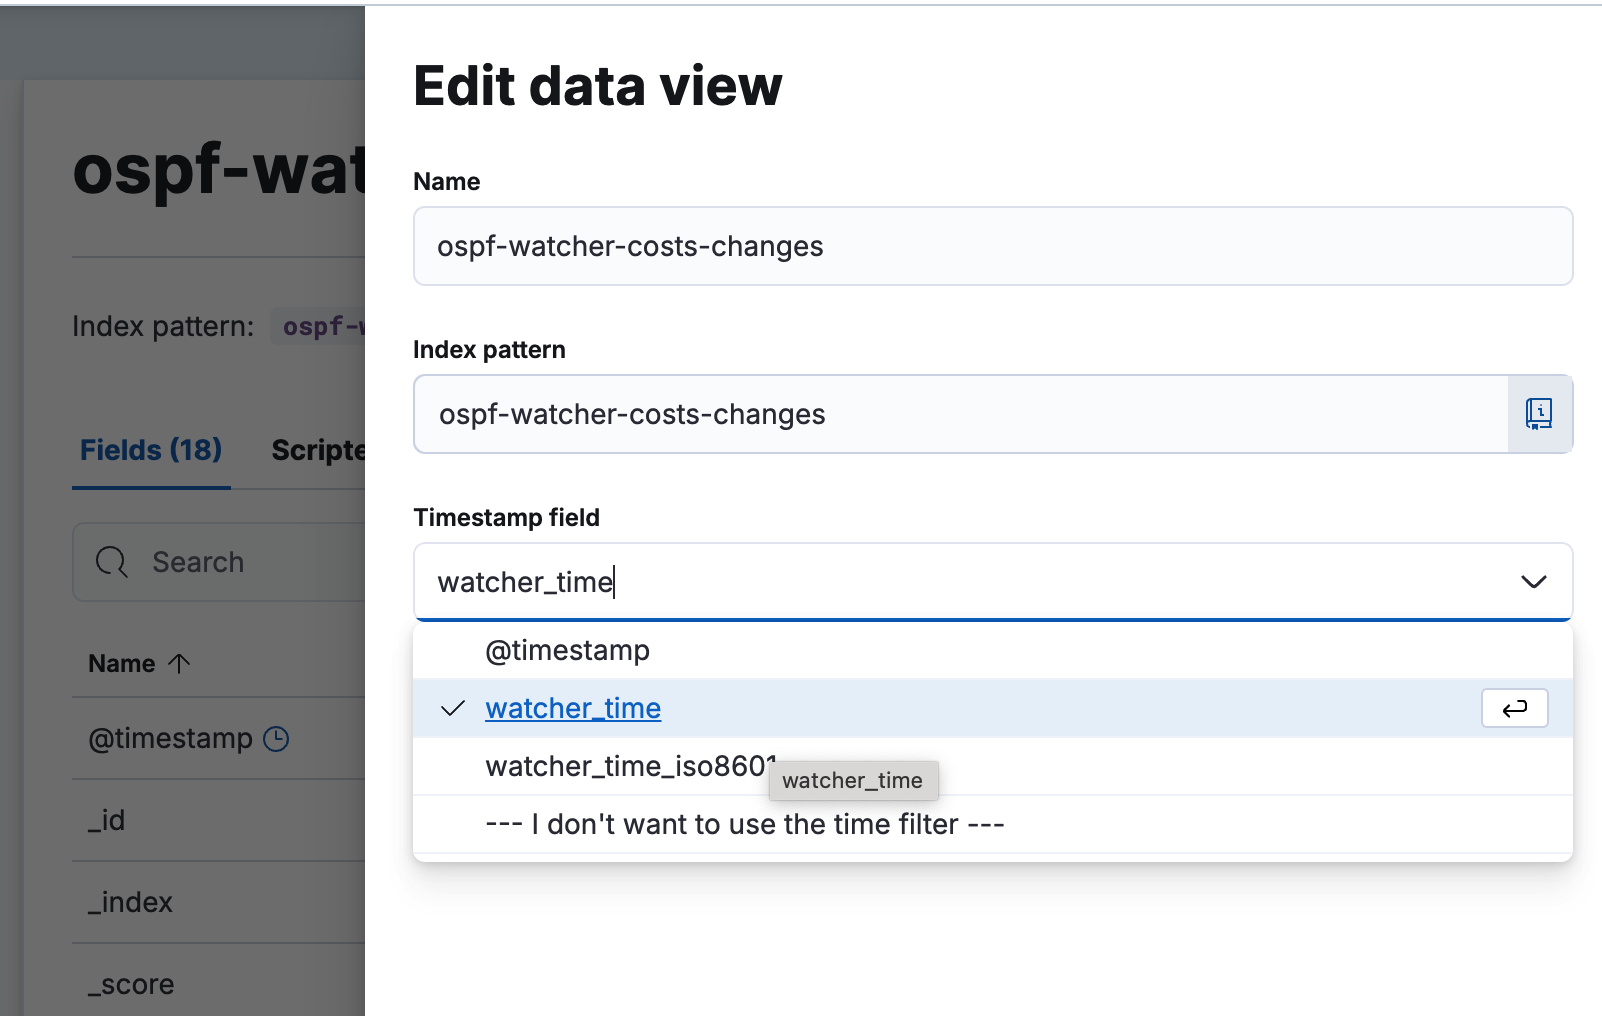
Then create a data view over the watcher indices to start exploring:
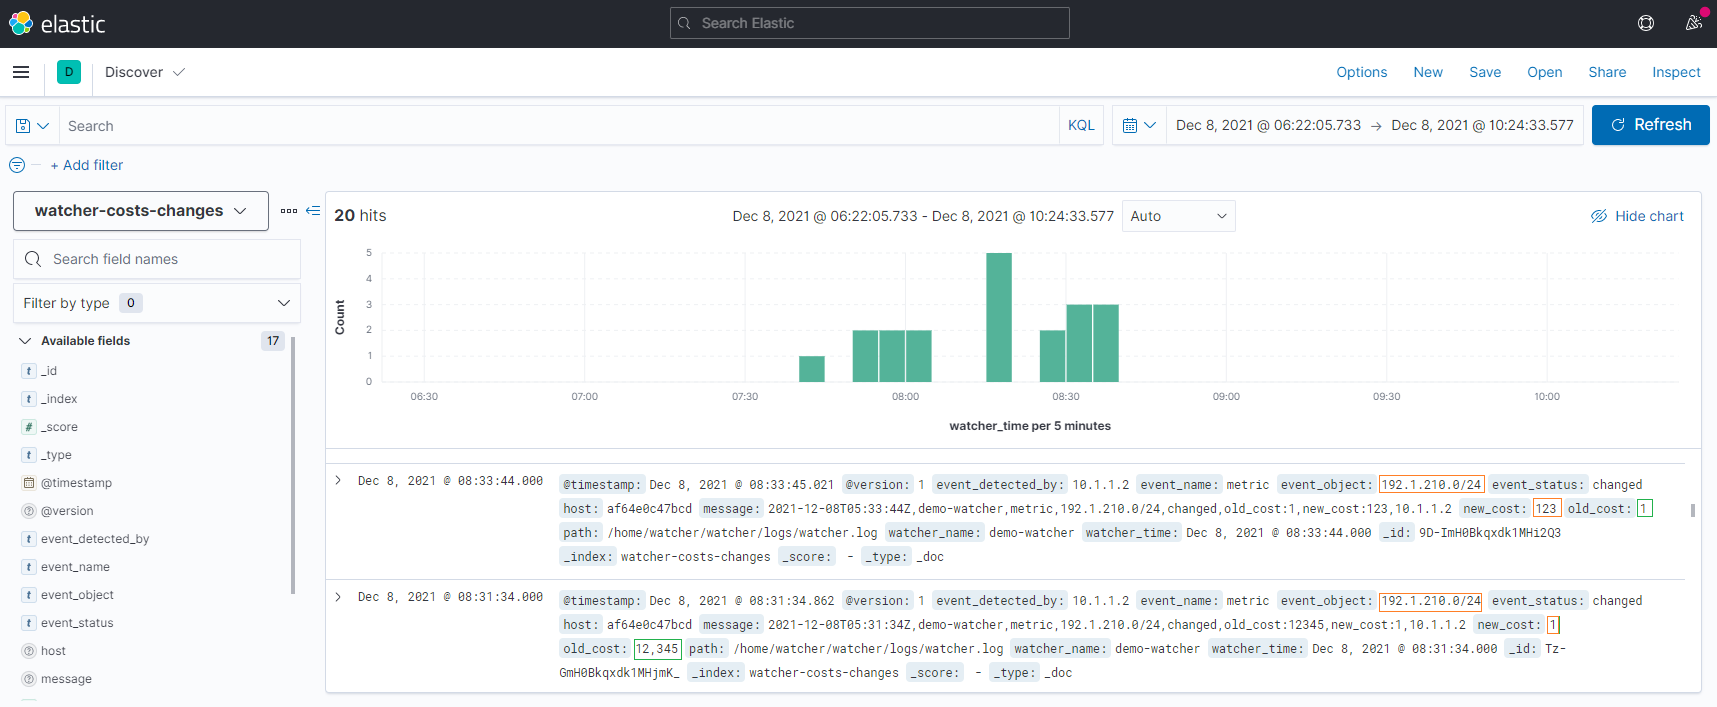
Exploring events
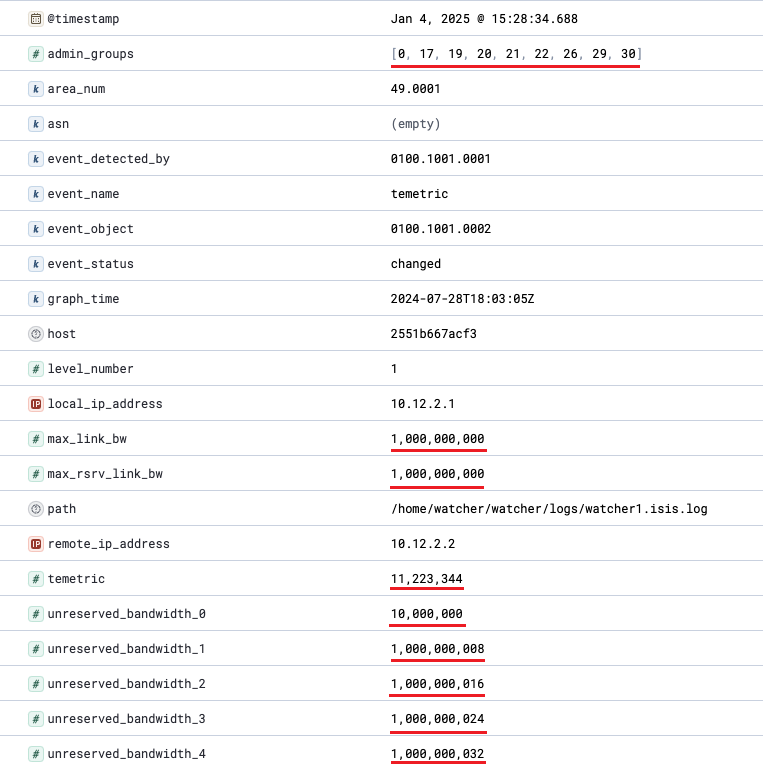
Once data flows, raw events are searchable in Discover:
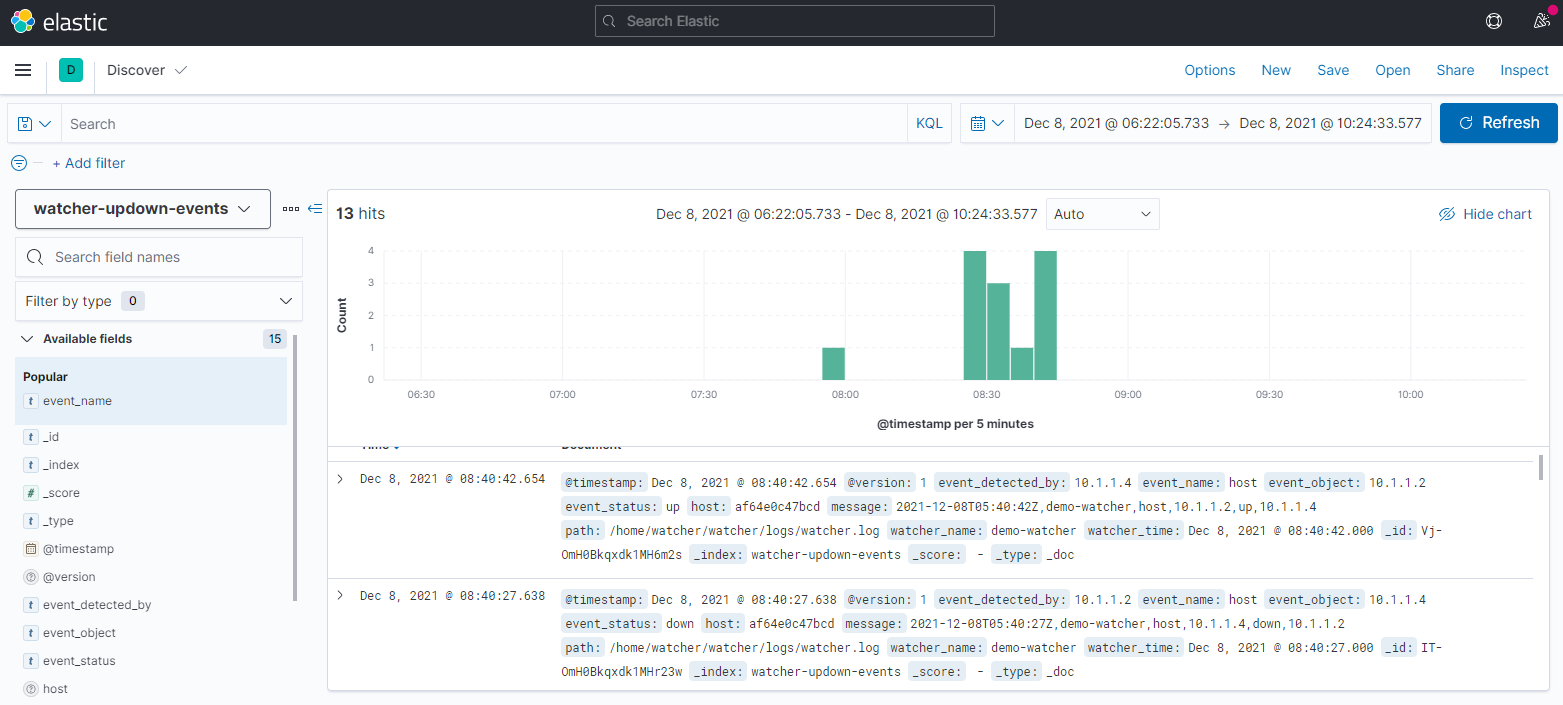
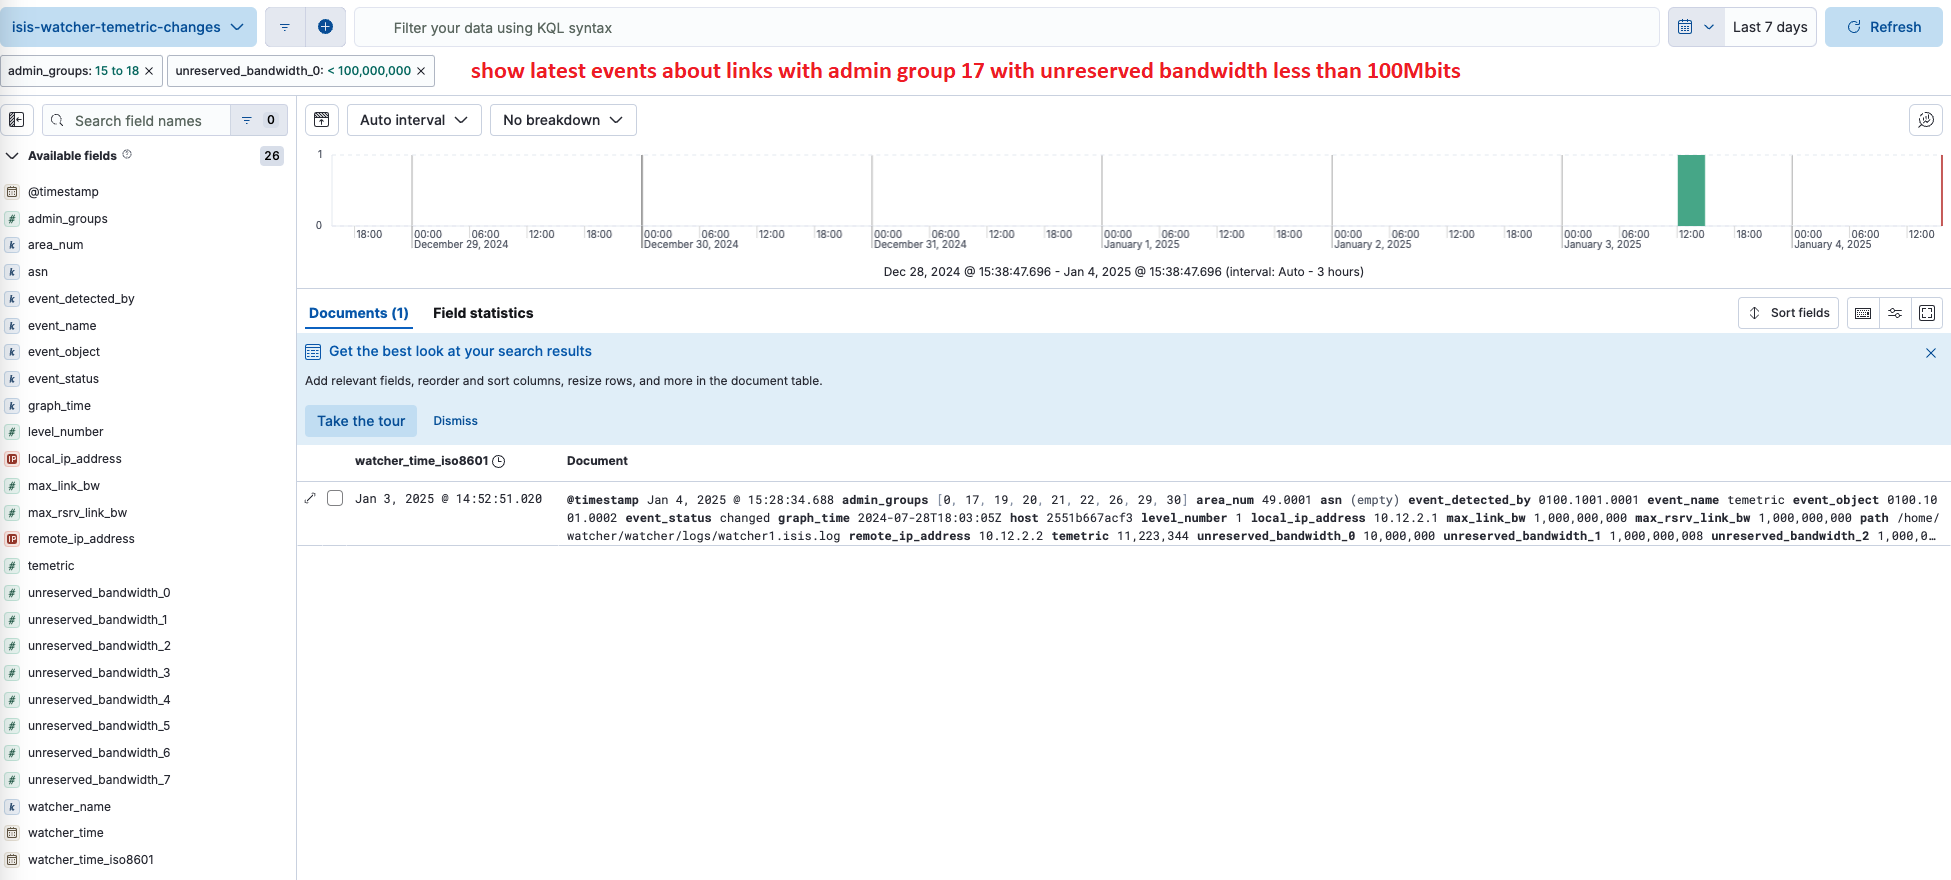
For TE, you can filter by attributes such as administrative group:
Related: Zabbix · Webhooks & Slack · Traffic Engineering