Traffic Engineering (TE)¶
Beyond the basic IGP cost, OSPF and IS-IS can carry Traffic Engineering attributes — bandwidth, a separate TE metric, and administrative groups/affinities. Topolograph parses these and makes them available for richer visualization and filtering, for both OSPF and IS-IS.
TE is optional
Your graph builds fine from plain LSA 1/2/5 (OSPF) or the standard IS-IS LSDB. TE data is extra — turn it on when you need capacity-aware analysis.
What Topolograph parses¶
| Attribute | API/SDK name | Meaning | Defined in |
|---|---|---|---|
| TE default metric | temetric |
TE-specific link metric (independent of IGP cost) | RFC 3630 §2.5.5 / RFC 5305 §3.7 |
| Administrative group | admin_group |
Affinity / color / resource class | RFC 3630 §2.5.9 / RFC 5305 §3.1 |
| Maximum link bandwidth | max_link_bw |
Physical link capacity | RFC 3630 §2.5.6 / RFC 5305 §3.4 |
| Maximum reservable bandwidth | max_rsrv_link_bw |
Bandwidth available for reservation | RFC 3630 §2.5.7 / RFC 5305 §3.5 |
| Unreserved bandwidth (per priority) | unreserved_bw_0 … unreserved_bw_7 |
Remaining bandwidth at each of the 8 TE priorities | RFC 3630 §2.5.8 / RFC 5305 §3.6 |
| Shared risk link group | srlg |
List of SRLG ids the link belongs to (RFC 4203 / RFC 5307) | RFC 4203 §1.3 / RFC 5307 §1.2 |
The same attribute names are used regardless of whether the data came from OSPF or IS-IS.
How to feed TE data in¶
Include show ip ospf database opaque-area in the same upload file as
your router/network/external LSDB. Type-10 (opaque-area) LSAs carry the TE
data; the rest of the graph is built from LSA 1, 2 and 5 as usual.
FRRouting and IP Infusion OcNOS are supported.
TE attributes come straight from the IS-IS LSDB when you use the detailed command of your vendor: show isis database detail (FRR), show router isis database detail (Nokia SR OS) or show isis database verbose (ZTE, IP Infusion OcNOS). No extra command is required beyond your normal IS-IS capture. Which attributes each vendor's parser reads is listed in TE attributes by vendor.
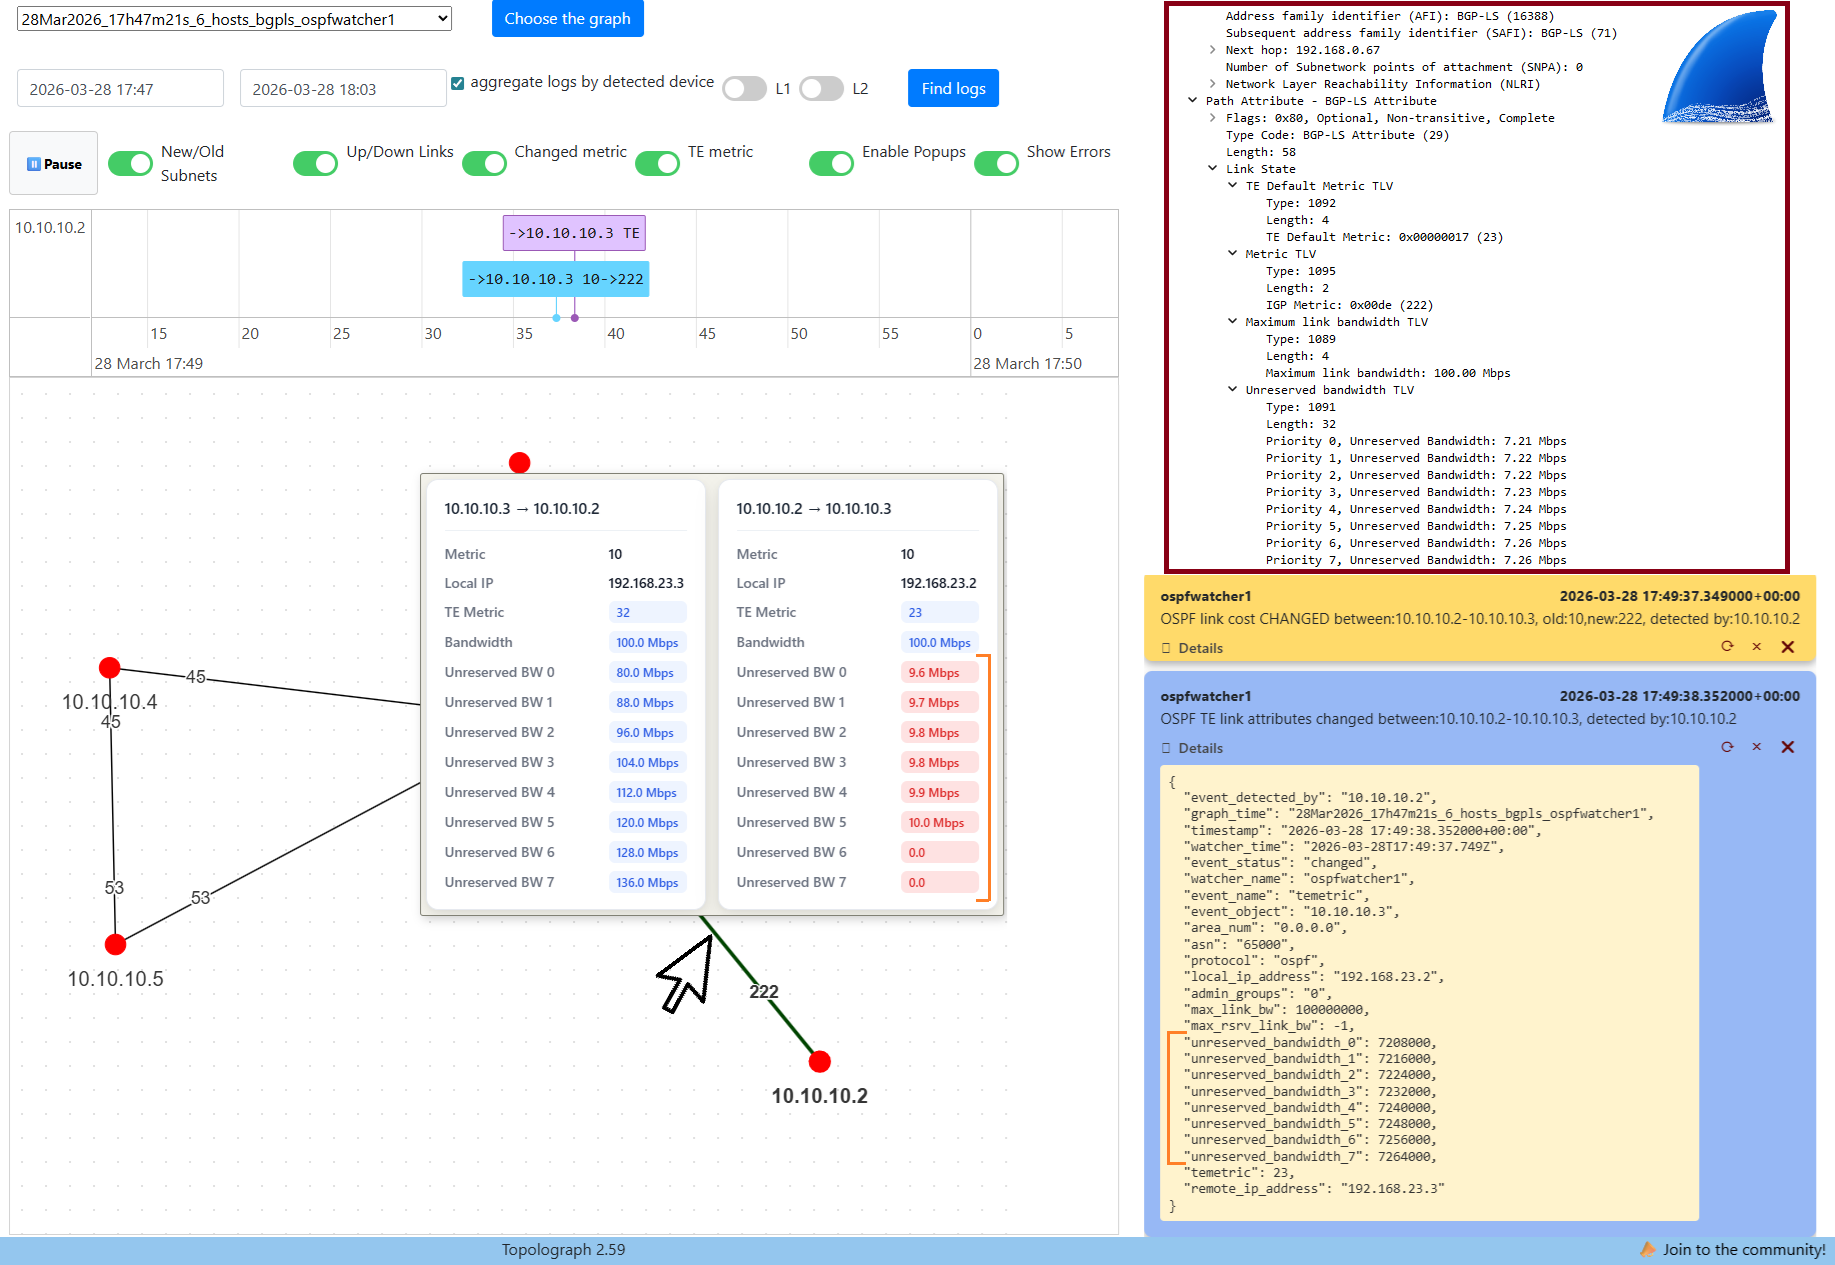
BGP-LS carries TE attributes natively — admin group, maximum and reservable bandwidth, unreserved bandwidth, SRLG, and the TE default metric — with no opaque-LSA trick needed. TE updates stream into the monitoring view live.
When TE data arrives over BGP-LS, the monitoring page shows the link attributes as updates come in:
Filtering links by TE attributes¶
Once a diagram has TE data, you can query edges by any TE attribute using the
range operators __gt, __lt, __gte, __lte — handy for finding links that
meet or fail a TE constraint. With the
Python SDK:
# Links with TE metric >= 100
edges = graph.edges_list(temetric__gte=100)

# Links with unreserved bandwidth at priority 0 below 1 Gbps
edges = graph.edges_list(unreserved_bw_0__lt=1e9)

# Links between two nodes with max link bandwidth above 10 Gbps
edges = graph.edges_list(src_node="1.1.1.1", dst_node="2.2.2.2", max_link_bw__gt=1e10)
The same filtering is available through the diagram edges REST API.
IS-IS specifics¶
IS-IS TE relies on Wide Metrics (Extended IS/IP Reachability, TLVs 22/135) and supports IPv6 reachability (TLV 236). Vendor support for the relevant TLVs is summarized on the Supported Vendors page.
The TE attributes read from each vendor are listed in TE attributes by vendor.
Monitoring TE changes¶
When a Watcher is connected, changes to TE attributes are captured as events
alongside cost and adjacency changes — see the te_log views in
ELK / Kibana and the
IS-IS Watcher page.
Related: Getting topology in · Visualizing & analyzing