Visualizing & Analyzing
This is the heart of Topolograph: an interactive OSPF/IS-IS graph you can probe with the same algorithms the routers use. Everything below runs against your uploaded snapshot, so experiments never affect the production network.
Shortest paths
Pick a source and a destination node and Topolograph builds the shortest path tree between them, highlighting the path(s) and showing the total IGP cost.
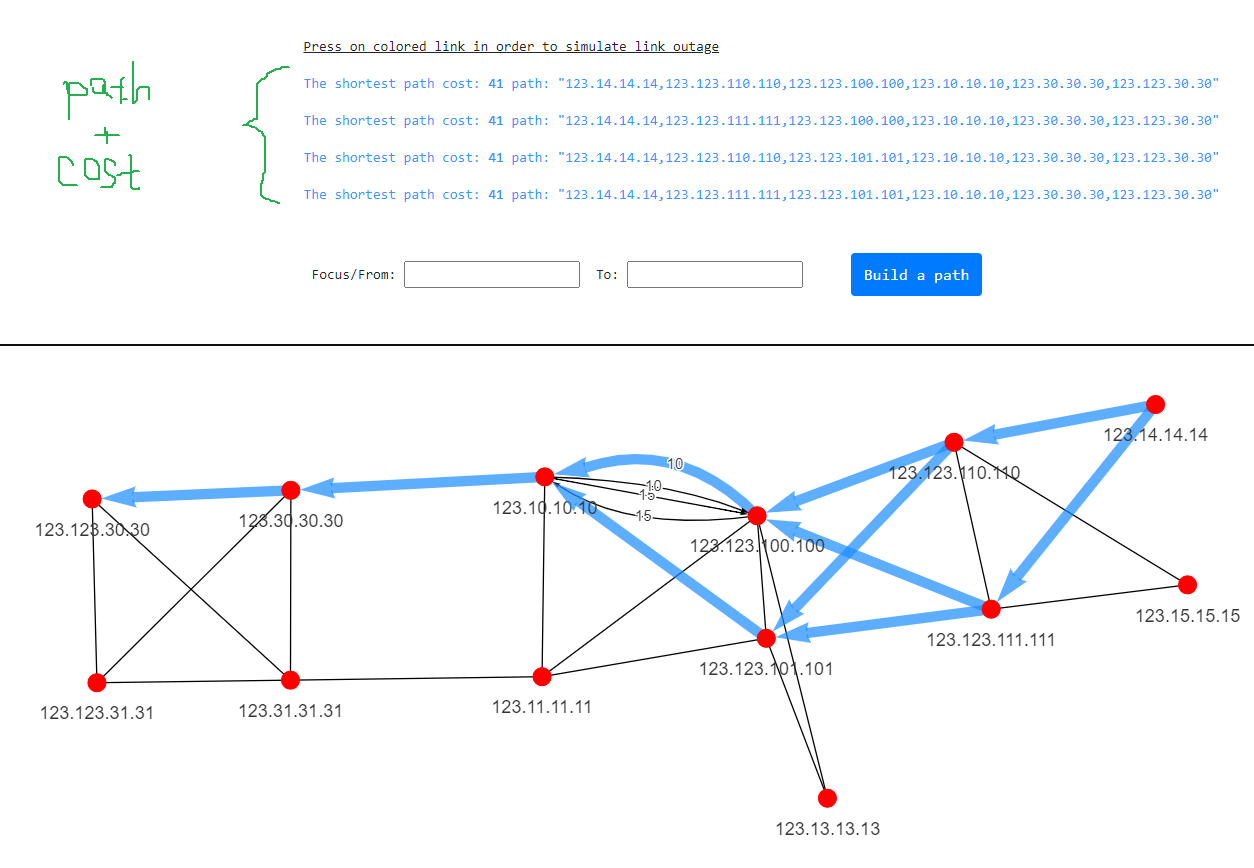
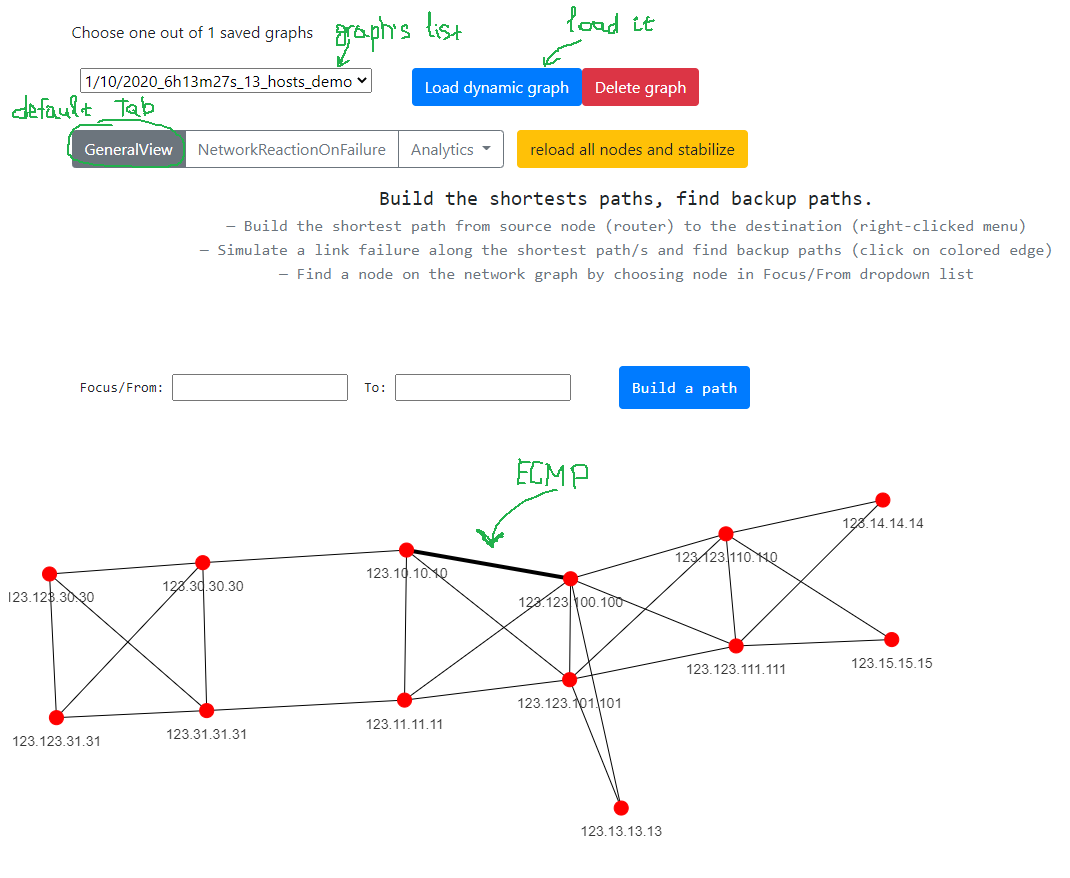
When multiple equal-cost paths exist, ECMP is shown explicitly so you can see where traffic load-balances.
Backup paths
Topolograph doesn't just show the primary path — it computes the backup path the network would actually use if the primary failed, including secondary backups. This answers the question every change-window raises: "if this link goes, where does the traffic go?"
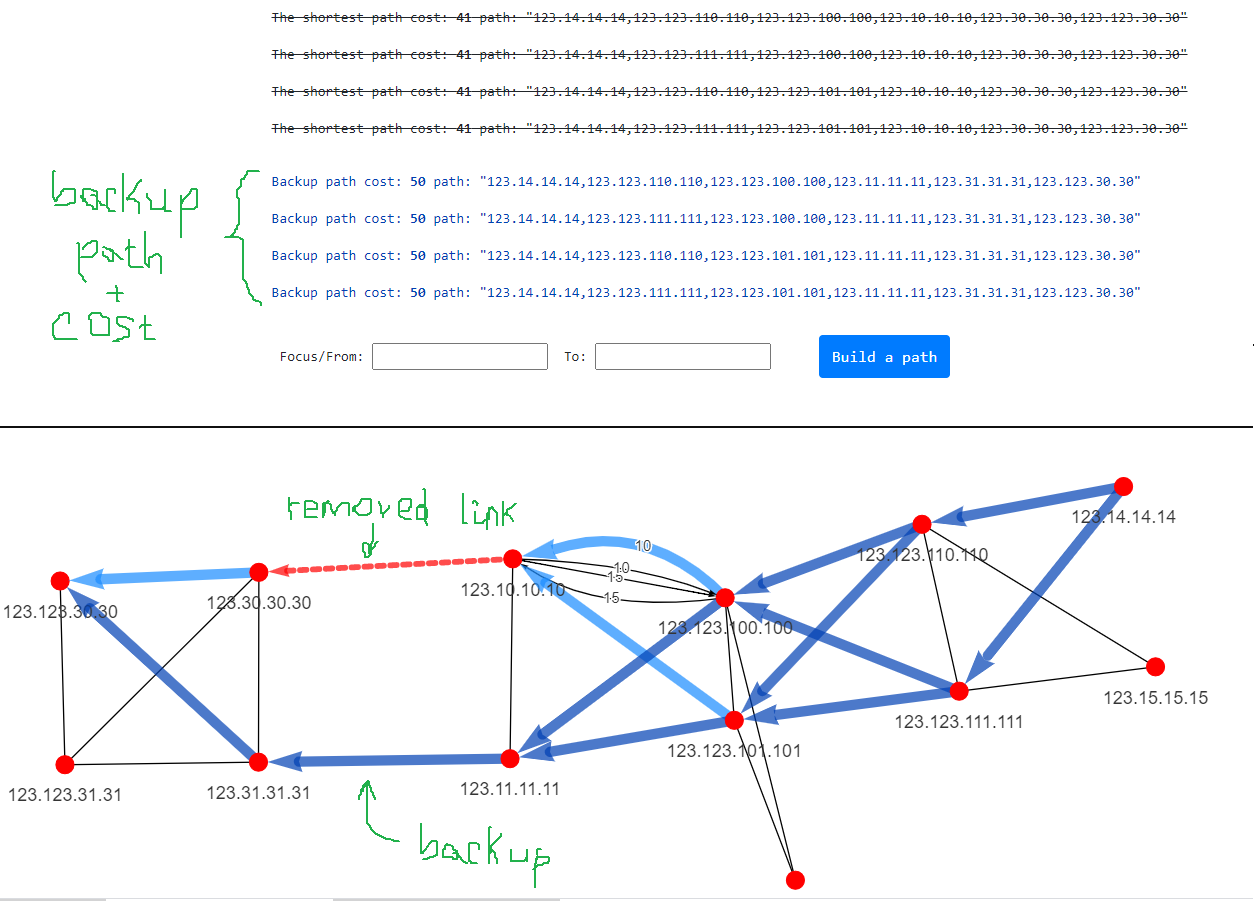
It also distinguishes backup paths that ride over ECMP from those that don't, which matters when you reason about capacity during a failure.
Simulating failures
Test "what if" without touching anything live.
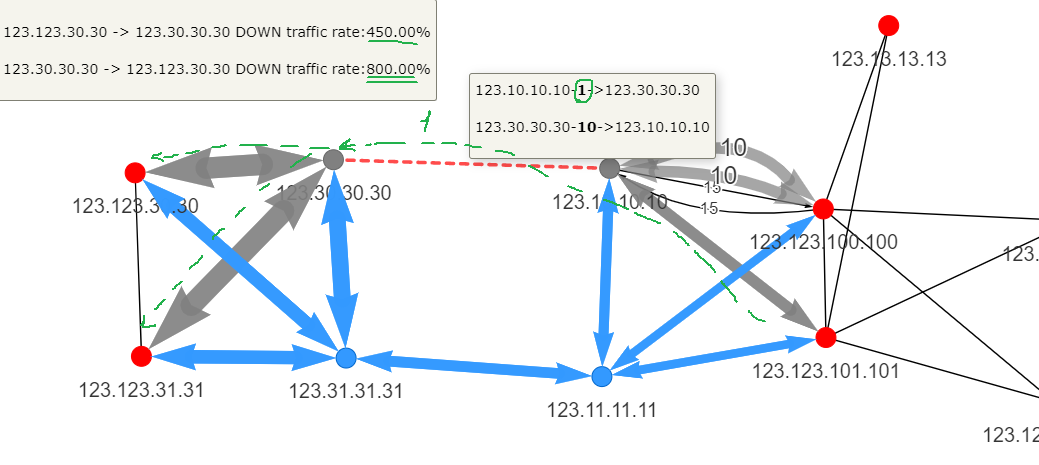
Shut a link
Remove a link and Topolograph recomputes paths instantly, showing how traffic re-routes around it.
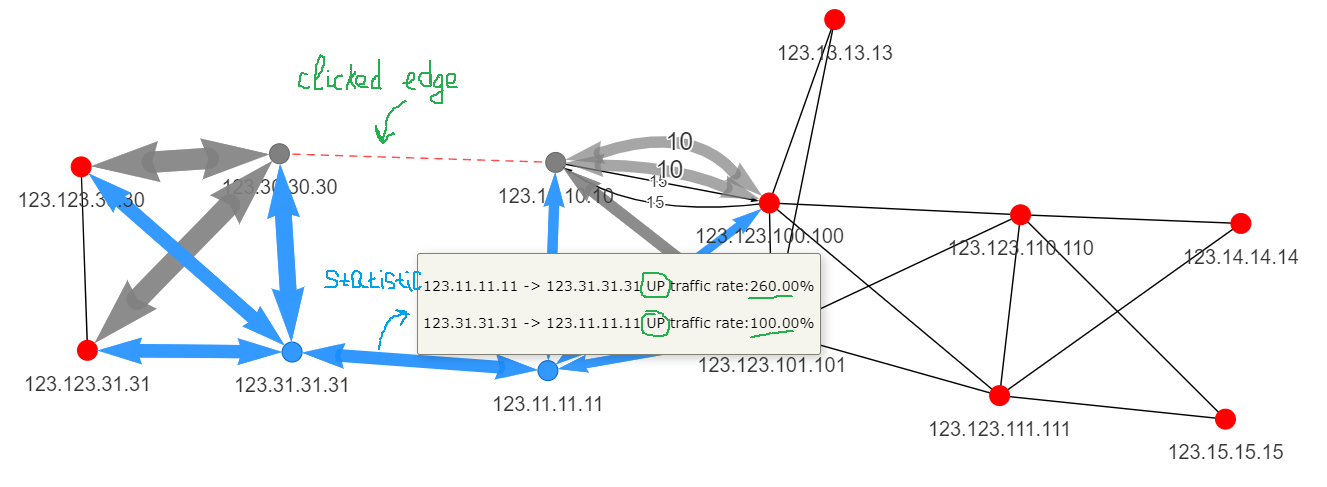
You can see the result together with the affected statistics:
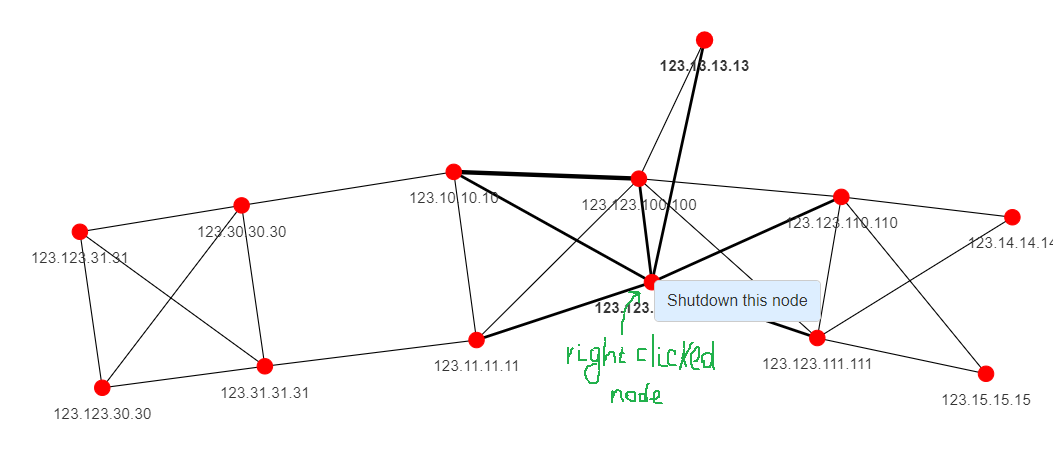
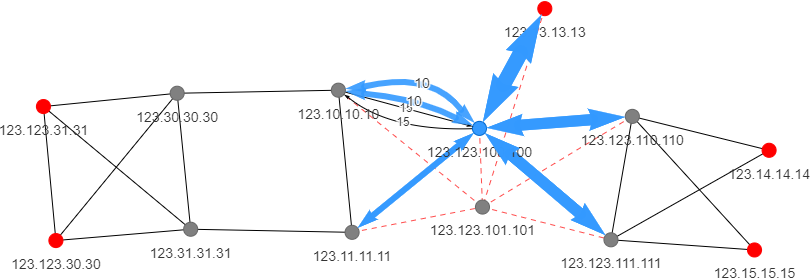
Shut a node
Take an entire router out and watch traffic flow around the failed node.
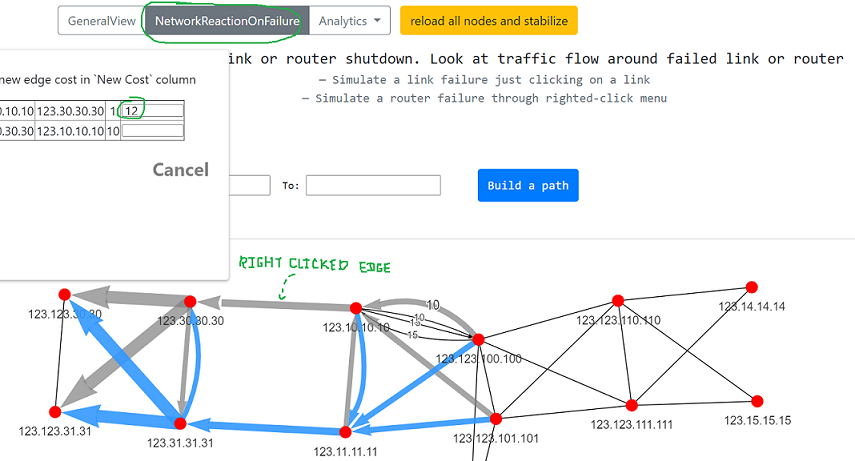
Planning link costs
Change an IGP metric on the fly and immediately see the effect on path selection — ideal for planning a maintenance, shifting traffic off a link, or validating a cost design before you push it.
Network Heatmap
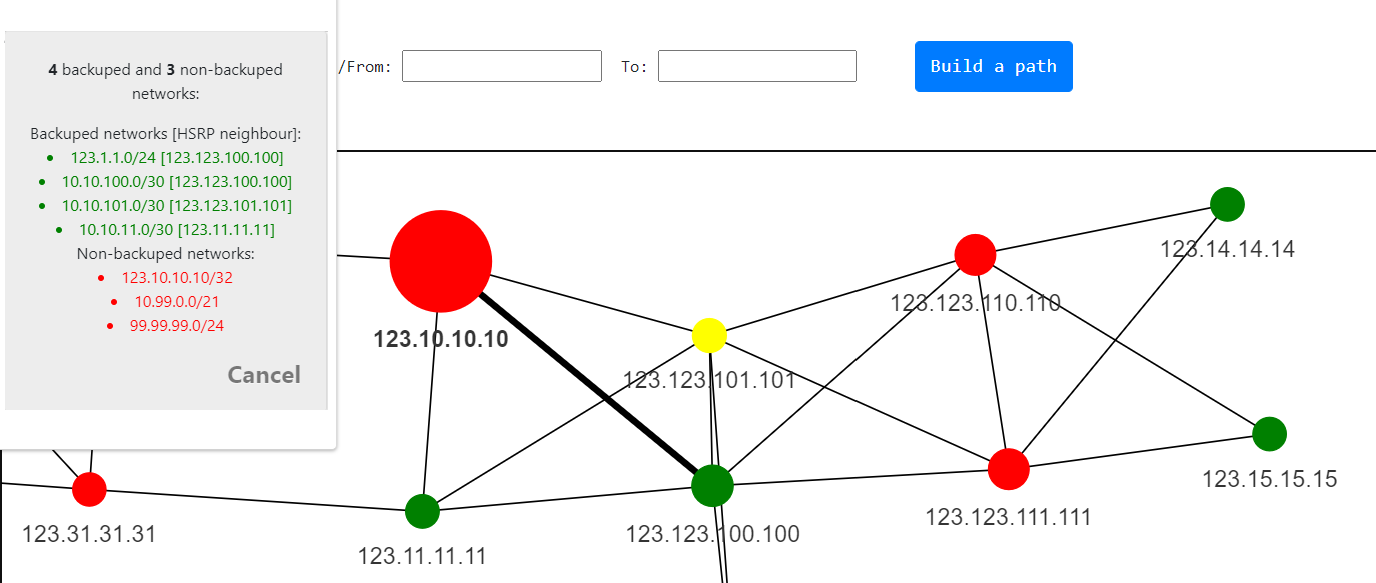
The Network Heatmap (under Analytics) reveals structural properties of the topology at a glance — which links and nodes carry the most paths, where your single points of failure are, and which networks have no backup path.
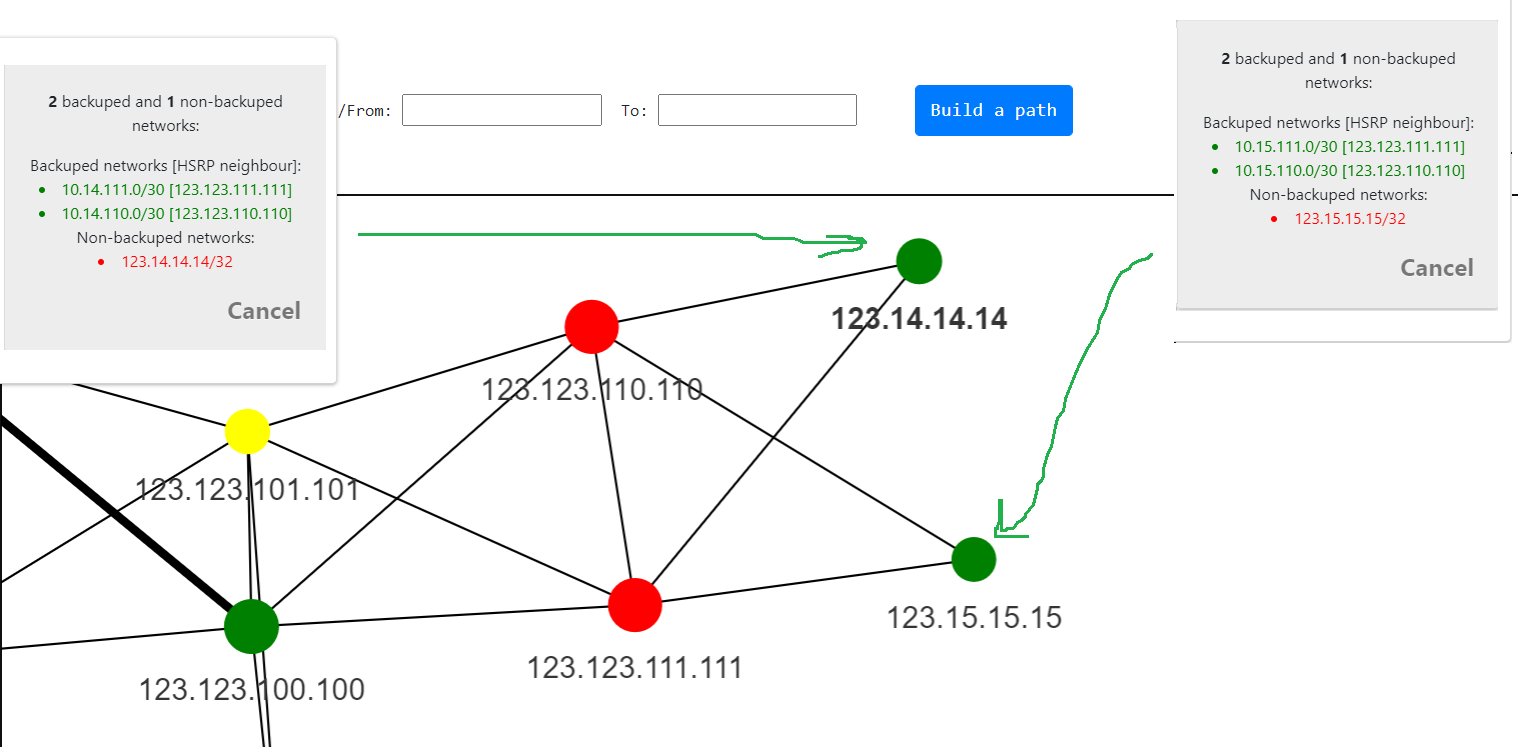
Filter to the networks that are not backed up to find exactly where a single failure would cause a loss of reachability:
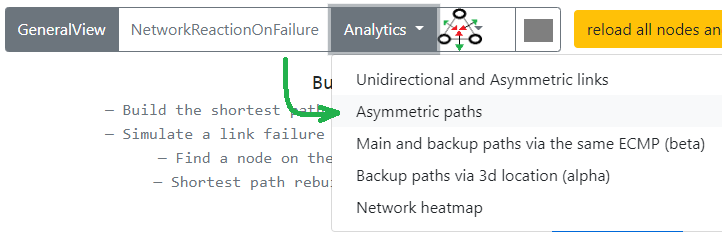
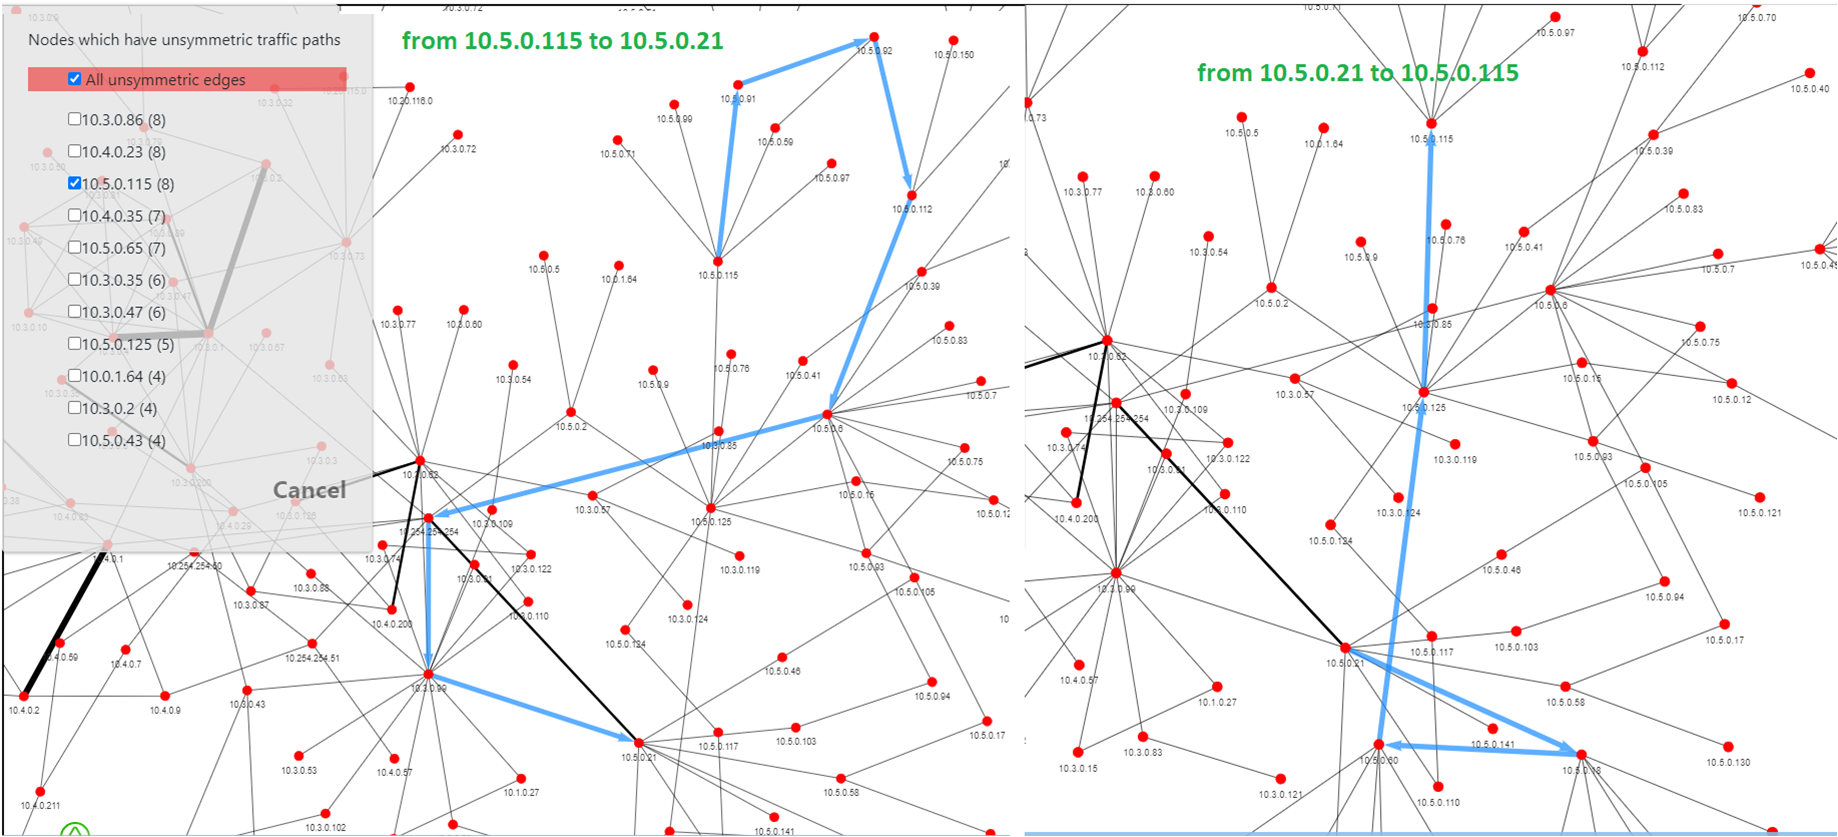
Detecting asymmetric paths
Routing that takes one path forward and a different path back can complicate firewalls, QoS and troubleshooting. Topolograph's Analytics → Asymmetric paths report finds these pairs for you.
Where to go next
-
Compare two snapshots
See what changed between captures.
-
Add TE data
Bandwidth, TE metric, admin groups.
-
Watch it live
Capture every change as it happens.