Real-Time Monitoring
A text-file snapshot tells you what the network looks like now. The Watchers tell you what it's doing — every adjacency that flaps, every cost that changes, every prefix that comes and goes — and turn each into a searchable, alertable event.
There are two Watchers, one per protocol, built on the same architecture:
-
OSPF Watcher
Monitors live OSPF topology changes via GRE or BGP-LS.
-
IS-IS Watcher
The same for IS-IS — including L1/L2 levels and IPv6.
What a Watcher does
A Watcher passively listens to the IGP control plane — over a GRE adjacency or a BGP-LS session — and for every change it:
- feeds the topology into Topolograph (so the graph stays current), and
- emits an event that can be shipped to one or more destinations:
flowchart LR
    W[Watcher] --> T[Topolograph<br/>timeline + graph]
    W --> L[Logstash / Fluent Bit]
    L --> E[ELK / Kibana<br/>search & dashboards]
    L --> Z[Zabbix<br/>alarms]
    L --> H[WebHook / Slack<br/>instant notifications]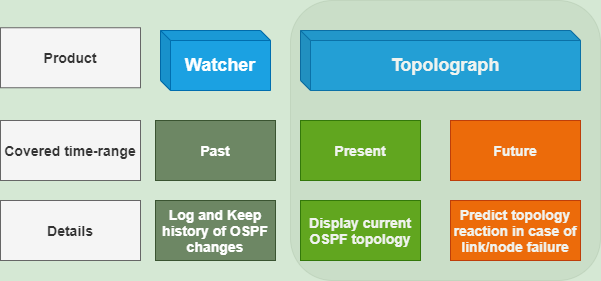
The Watcher stores the history of events (what happened and when); Topolograph shows the present state and lets you explore potential future outcomes.
Detected events
Both Watchers detect the same classes of change:
- Neighbor adjacency up / down
- Link cost changes (old → new metric)
- Networks/prefixes appearing or disappearing
- TE attributes — admin group, max/reservable/unreserved bandwidth, TE metric (see Traffic Engineering)
IS-IS additionally groups everything by level (L1/L2).
Connection modes
Connection setup lives under Getting Topology In:
- GRE session — broadly compatible; needs a GRE tunnel and an IGP adjacency per area/level.
- BGP-LS session — no tunnel; a single session
carries the whole domain. Needs Watcher image
v3.1.0+.
Deployment sizes
You can start as small as a containerlab demo and grow to a full Watcher + Topolograph + ELK stack. A typical progression:
| # | Deployment | Text logs | View on map | Zabbix / Slack | Search events |
|---|---|---|---|---|---|
| 1 | Bare minimum (containerlab) | ✅ | ❌ | ❌ | ❌ |
| 2 | Local Topolograph + Watcher (ELK off) | ✅ | ✅ | ✅ | ❌ |
| 3 | Local Topolograph + Watcher + ELK | ✅ | ✅ | ✅ | ✅ |
| 4 | As #2 but Fluent Bit instead of Logstash | ✅ | ✅ | HTTP/Webhook only | ❌ |
The install.sh script from
topolograph-docker can bring up
Topolograph and a Watcher together.
Watcher heartbeats
Each Watcher can periodically POST a heartbeat to Topolograph, so the UI
lists every registered Watcher with a liveness status (up / stale / down) —
independent of whether the network is currently producing events.
Multi-watcher organisations
Watchers that should appear together in the UI must share one Topolograph user / API token. Requires Topolograph v3.x or later.
Exporting events
-
ELK / Kibana
Index events, search them, and build dashboards.
-
Zabbix
Raise alarms on adjacency, cost and network events.
-
Webhooks & Slack
Get instant notifications in your chat tool.