What is Topolograph?
Topolograph is a web-based tool for visualizing and analyzing OSPF and IS-IS network topologies — offline, self-hosted, and with no logins or passwords required.
Because OSPF and IS-IS are link-state protocols, every router in an area holds an identical copy of the area's Link-State Database (LSDB). That means Topolograph can reconstruct the entire topology from the LSDB of a single device. Feed it that database — as a text file, or as a live feed — and it builds an interactive graph of your network exactly as the protocol sees it.
Why use it
A running IGP knows everything about your topology, but that knowledge is hard to see and impossible to experiment with on the live network. Topolograph turns the LSDB into something you can explore and test:
- Visualize the OSPF/IS-IS topology as an interactive graph.
- Build shortest paths between any two nodes — and discover the backup paths (including secondary backups) the network would use.
- Simulate failures — shut a link or a router and watch how traffic re-routes, before you touch production.
- Plan link costs — change IGP metrics on the fly and see the effect on path selection.
- Find weak spots — identify the most loaded nodes and links, single points of failure, and networks that have no backup path.
- Compare snapshots — take a topology snapshot, make a change (e.g. a route-map redistribution), upload the new state, and see exactly what changed.
- Detect asymmetric routing between any pair of endpoints.
- Monitor in real time — stream live changes from the network and alert on them.
All of this happens on your snapshot of the topology, so experiments never affect the production network.
How a topology gets in
Topolograph accepts the same link-state data three different ways. See Getting Topology In for the full picture:
| Method | How it works | Best for |
|---|---|---|
| Text file | Paste/upload show ... database output from one router |
Audits, one-off analysis, offline planning |
| GRE session | A Watcher forms a GRE adjacency and forwards live LSAs/LSPs | Continuous monitoring of an existing network |
| BGP-LS session | Link-state is carried natively over BGP-LS via GoBGP | Modern networks, no tunnel, multi-area/level |
You can also push topology programmatically through the REST API and Python SDK.
The Topolograph suite
Topolograph is the centerpiece of a small family of components that share the same data model:
flowchart LR
    R[Routers<br/>OSPF / IS-IS] -->|text file| T
    R -->|GRE| OW[OSPF / IS-IS Watcher]
    R -->|BGP-LS| GB[GoBGP + forwarder]
    GB --> OW
    OW -->|live events| T[Topolograph]
    OW -->|events| ELK[ELK / Kibana]
    OW -->|alerts| Z[Zabbix / Slack]
    SDK[Python SDK / CLI] -->|REST API| T
    MCP[MCP Server] --> T
AI[AI Agent] --> MCP| Component | Role |
|---|---|
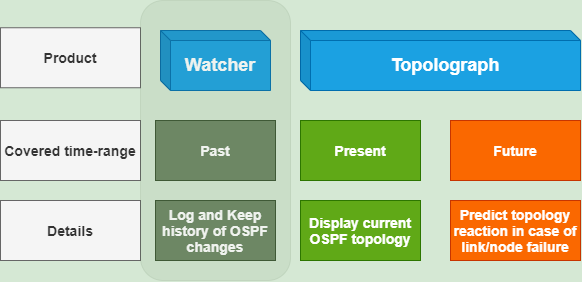
| Topolograph | The web application — visualization, path analysis, failure simulation, comparison, real-time dashboard. |
| OSPF Watcher | Containerized agent that monitors live OSPF changes (GRE or BGP-LS) and exports events. |
| IS-IS Watcher | The same idea for IS-IS, including L1/L2 levels and IPv6. |
| Python SDK | Object-oriented REST client, SSH-based LSDB collector (Nornir), and the topo CLI. |
| MCP Server | Exposes the Topolograph API to LLM agents via the Model Context Protocol. |
| AI Agent | A natural-language assistant that answers questions about your IGP. |
What Topolograph is not
- It is not a routing daemon — it never injects routes or talks to the forwarding plane. Watchers are passive listeners.
- It is not a NMS replacement — it focuses specifically on link-state IGP topology and its analysis.
- It does not require credentials to your devices to analyze a topology — a text file is enough. (Credentials are only needed if you let the SDK collect LSDBs over SSH for you.)